
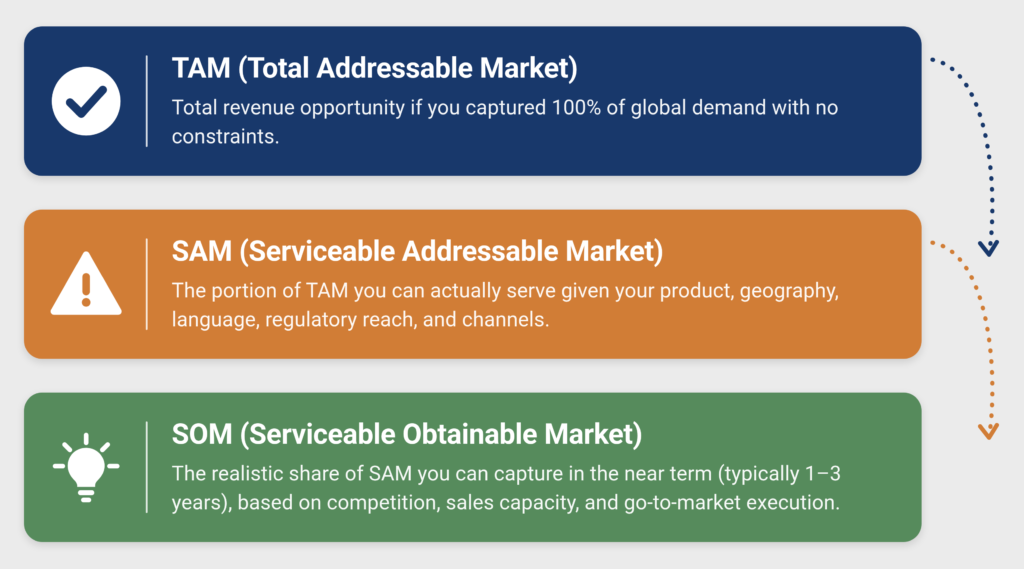
Most growth papers put two numbers in front of a board, and both of them look equally solid. Directors treat the serviceable obtainable market as an estimate of the outside world, and they treat the activity plan beside it as the part management controls. That reading is upside down. The cost of getting it backwards usually shows up two quarters later, when the revenue has not arrived and nobody in the room can explain the gap.
The two halves of every growth paper
When Founders and CEOs raise money to add a product line or enter a new territory, they present a familiar pair of exhibits. One side carries the market sizing: total addressable market (TAM), narrowed to the serviceable addressable market (SAM), narrowed again to the serviceable obtainable market (SOM). The other side carries the story of the competition and the delivery case. That exhibit lists the activities and puts a budget against each line. It also sets out the strategy map, the hiring plan, the channel arrangements and the timeline. Boards test the arithmetic on both sides, ask about competitive response, and then sign. Capital moves on the strength of the line drawn between those two exhibits.
That line is the entire proposition. It claims that these particular activities, at this particular cost, will reach that particular slice of the market. Approval is therefore never really a vote on the product. It is a vote on a claimed correspondence between a plan and a set of customers you can actually touch.
TAM describes the world, SOM describes you
Here is the distinction that rarely gets said out loud in a board meeting. TAM and SAM sit largely outside your control. They describe category size, geography, regulation and spending capacity, and they would look much the same if a competitor wrote them. The serviceable obtainable market SOM behaves completely differently, because it belongs to you rather than to the market. It follows from your plan. Your route to market sets it, along with your price point, your packaging, your service model, your credit terms, your qualification criteria and the languages your support desk covers.
Change any of those and you change who you can reach, so your serviceable obtainable market travels with every one of them. The product may be identical. The reachable set is not. That is why “our product has not changed, so our market has not changed” ranks among the most expensive sentences in corporate planning.
What actually happens in the first few Quarters
Hold the outside world still for a moment. Assume the category has not moved, no new competitor has landed, and regulation stays quiet. On paper, then, the serviceable obtainable market should be exactly where you left it.
Meanwhile the plan might be moving every single week:
- The channel partner you counted on wants a different margin, so you have to restructure the discount.
- Onboarding takes eleven days instead of three, so the sales team starts screening for customers with in-house IT.
- The pilot city proves expensive, so you decide to shift to two smaller ones.
- Training slips, so the first cohort of field engineers covers a narrower product set.
- Teams defend each of these decisions on its own merits on a Weekly review, and each one is usually the right local call. Together they might have redrawn the boundary of who you can serve, and the serviceable obtainable market SOM redraws itself in the same motion – but you have most likely ignored it.
Lean-startup language has a word for a declared change of direction, and it calls that a pivot. What I am describing here stays undeclared. Nobody logs it as a change of strategy, because it never feels like one.
The board review interrogates the wrong suspects
Two or three reviews in, when the numbers fall short, the board does what boards do and lines up possible suspects. Either the market estimate was wrong, the budget or people against the activities was wrong, or the implementation was poor. Management defends itself against all three, usually by promising better execution of a plan it has already quietly changed. Looks and feels like a routine digression.
The actual culprit is hiding due to a careless omission. Nobody has restated the SOM to match the plan now running. So, the variance analysis compares today’s results against a target belonging to a plan the company might have abandoned in month two. A variance against an obsolete number carries wrong or no information.
If you are curious which of your assumptions have quietly moved since board approval?
[Start with a free consultation.](https://100dayrenew.com/booking)
Why nobody restates the number
Simply put, the Incentives are missing here. Restating the SOM downward reopens the funding case and reopening the funding case invites questions about the original approval. Lovallo and Kahneman described the optimism that inflates such forecasts at the outset. Planners take an “inside view” of their own project, they argued, and ignore the record of comparable ventures. Flyvbjerg’s published response added the harder point: alongside honest optimism sits deliberate misrepresentation, because the people preparing a case know which numbers win approval. Neither force encourages anyone to walk back into a boardroom carrying a smaller market. The number therefore survives on the slide even though it is not true.
What boards and investors should ask instead
More rigour in the original estimate will not fix this, since no estimate can truly match real time implementation. A reconciliation discipline will. The job is not to forecast better at the outset, but to keep the forecast honest while the plan mutates a few times.
McGrath and MacMillan set out the method thirty years ago under the name “Discovery-driven planning”. Document the assumptions, then revisit them at each milestone instead of treating the plan as a commitment. Most companies still do the first half and skip the second. So here is what I ask clients to install, and what I would want as a director.
- An assumption register that ties each activity to the customer segment it unlocks. When the activity changes, the segment entry changes with it.
- A standing agenda item in every review: what changed in the plan this period, and what did that do to the market we can reach and the cost of reaching it?
- A restated SOM at each milestone, shown beside the original, with the delta explained by plan changes rather than by market movement.
- Unit economics rebased on the same cycle, because drift in the RTM moves your acquisition cost as well.
That last line is where investors carry the most exposure. You underwrote a cost per customer and a quantity of customers, and the drift has since moved both while the funding case sat unrevised. Two numbers have changed, not one.
The discipline costs little, while the omission can be expensive.
There is no need for new analytics. It demands somebody in the room whose job is to ask some unglamorous questions, plus a governance rhythm that makes the answer visible. CB Insights, reviewing 431 venture-backed companies that shut down since 2023, found poor product-market fit cited in 43 per cent of cases, second only to running out of capital. Read those two findings together and something uncomfortable emerges.
Companies rarely die because the market was absent. They die holding a SOM they stopped earning the right to set a claim on. The estimate on the slide had stopped matching the company they had become due to the many drifts.
Unfortunately, the real cost of this omission will never appear on any variance report. It lands as a sharp responsibility on the CEO and the Board which might have lost confidence in a team that was, in fact, adapting sensibly. I have watched capable people resign over this gap alone. Recalculate the numbers with honesty and protect these people.
Book your free Business Diagnostic at [100dayrenew.com/booking](https://100dayrenew.com/booking). Limited slots each month.
References and source hierarchy
Tier 1: Foundational management scholarship (academically authored, practitioner journal)
Ansoff, H. I. (1957). “Strategies for Diversification.” Harvard Business Review, 35(5), September to October 1957.
McGrath, R. G. and MacMillan, I. C. (1995). “Discovery-Driven Planning.” Harvard Business Review, July to August 1995. https://hbr.org/1995/07/discovery-driven-planning
Lovallo, D. and Kahneman, D. (2003). “Delusions of Success: How Optimism Undermines Executives’ Decisions.” Harvard Business Review, July 2003. https://hbr.org/2003/07/delusions-of-success-how-optimism-undermines-executives-decisions
Flyvbjerg, B. (2003). “Delusions of Success: Comment on Dan Lovallo and Daniel Kahneman.” Harvard Business Review, 81(12), 121 to 122. Open access copy: https://papers.ssrn.com/sol3/papers.cfm?abstract_id=2278359
Tier 2: Industry research and practitioner publications
CB Insights (2026). “Top Reasons Startups Fail,” published 5 March 2026. Analysis of 431 venture-backed companies that shut down since 2023: ran out of capital 70 per cent, poor product-market fit 43 per cent, bad timing or macro conditions 29 per cent, unsustainable unit economics 19 per cent. Companies cited more than one reason, so percentages exceed 100. https://www.cbinsights.com/research/report/startup-failure-reasons-top/
Ries, E. (2011). The Lean Startup. Crown Business. Source of the term “pivot” as a declared change of business-model direction.
Tier 3: First-person practitioner construct
The central argument, that the serviceable obtainable market (SOM) is endogenous to the implementation plan and therefore silently revises itself as the plan drifts, is my own construct from consulting and board work. The assumption register, the standing reconciliation agenda item and the rebasing of unit economics are practice recommendations, and the article presents them as such.